Entry 32
Assessing the predictability of heatwaves over India through extended range maximum temperature forecasts of the NCEP CFSv2 model
Abhishek Bhatia

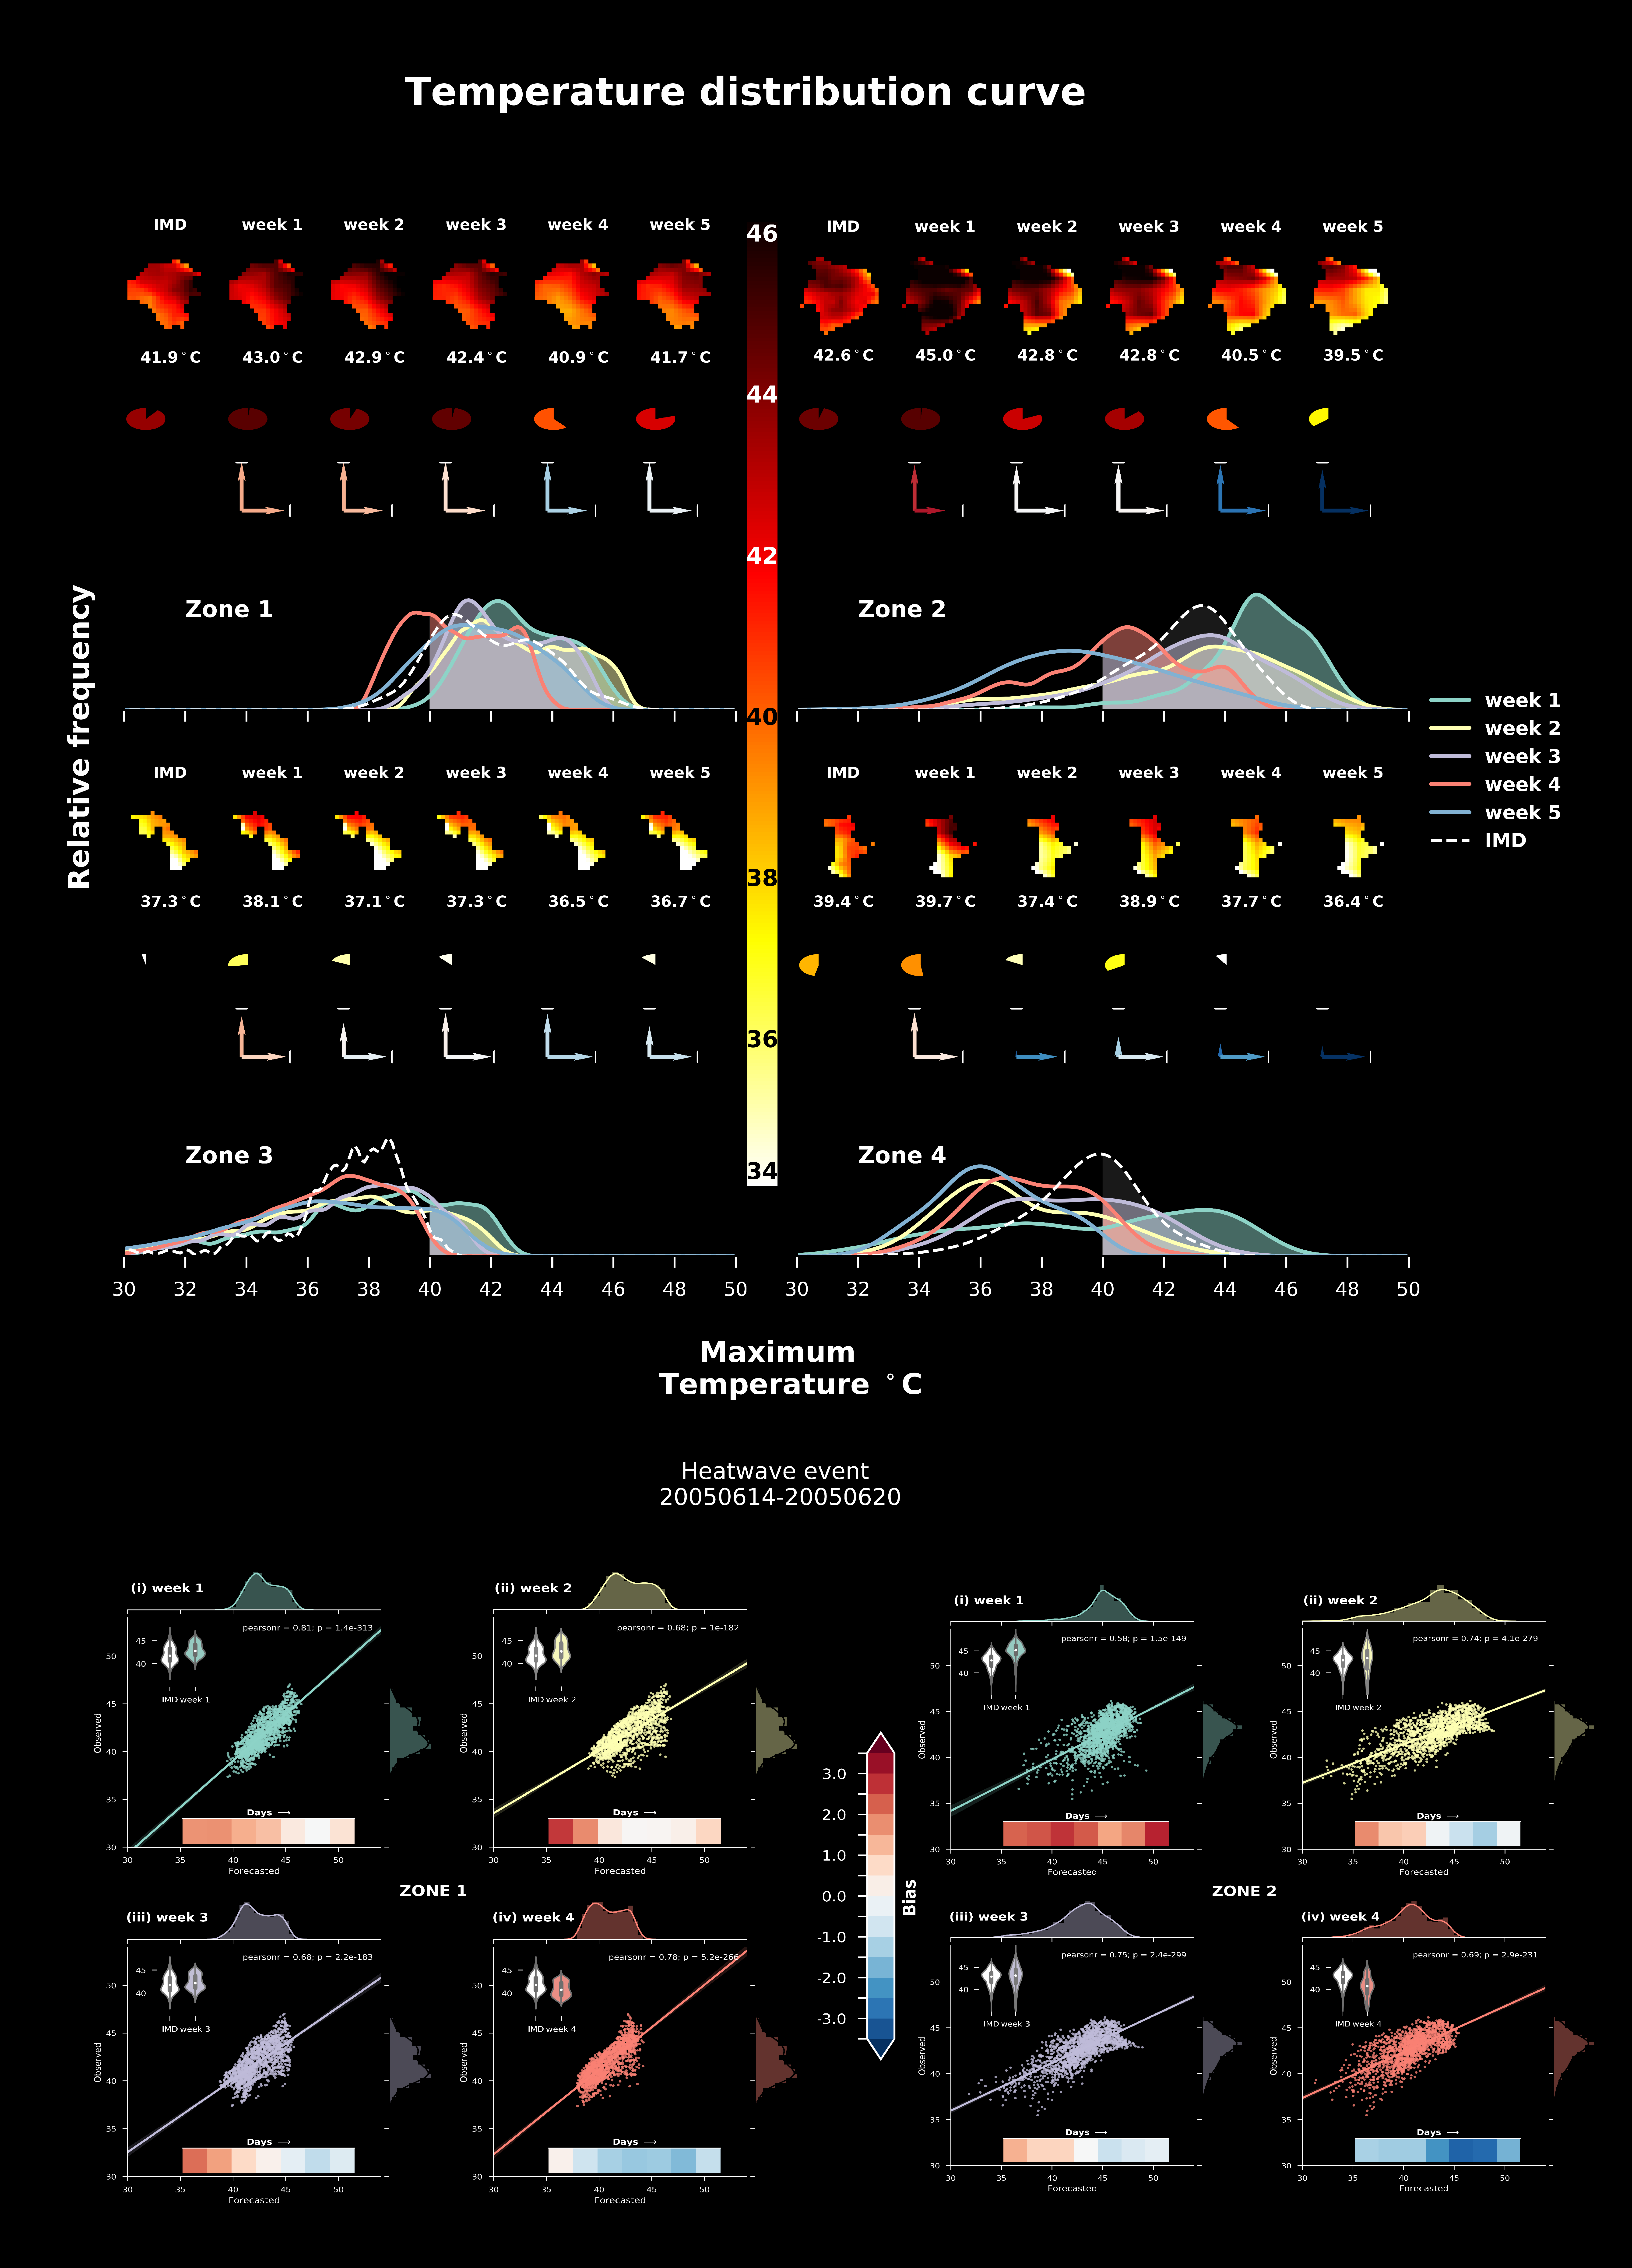
Rising global average temperatures are expected to increase the frequency as well as severity of the heat waves. The most intense heatwaves with maximum temperatures exceeding over 45 degrees Celsius occur in parts of central and north western parts of India, occur mostly in the month of May. An assessment of these extremes in terms of various proxy indices (onset date, intensity, duration, persistence etc.) and their predictability through weather/climate models has vital implications for early preparedness to mitigate the death toll and also for an effective management of regional water resources especially in the agricultural sector. It is thus imperative to assess the skill of these models to foresee these events days or even weeks in advance. The present study makes use of numerical weather prediction models (based on fully coupled GCMs) outputs from two operational centres, the (NCEP) CFSv2 and (CMA) BCC CPSv1, made available under the WWRP/WCRP S2S collaboration project on the ECMWF data portal. The skill in forecasting the maximum temperature is assessed at subseasonal scales (~ upto 5 weeks in advance), and an appropriate signature of the heatwaves is expected to be captured by these models at extended ranege lead times due to the presence of coupling. The forecasts are based on an 8-member ensemble aggregated using forecasts from two consecutive days (Lagged ensemble forecasting) The submitted figure shows the distribution curves of maximum temperatures (NCEP model) during the week of the heatwave event (20050614-20050620) for 4 zones defined in the study (based on most heatwave affected meteorological zones of India). IMD refers to the maximum temperature observation data acquired from the INDIA METEOROLOGICAL DEPARTMENT. A hot bias is noted across all four zones, in the 1st and 2nd week of the forecast, with decreasing (max) temperatures at longer lead times. This is depicted using spatial plots for each zone at different lead times, and the hot bias is also evident by the rightward shift of the PDFs which gradually move leftwards as the lead time increases. The area above 40 degree C is shaded (one of the critical criterion for declaring a Heat wave) , and the respective % is depicted by the fill and colour intensity (light yellow to red) of the small embedded pie charts. It is clear that the model is able to successfully delineate Zones 1 and 2 as the most severely affected heatwave regions, and the corresponding correlations of the spatial patterns in the zonal and meridional direction are depicted by the length of the arrows. Though a very hot bias is noted at lower lead times, which turns to a cold bias by the 4th week, the spatial patterns of the heatwave are well delineated especially for Zones 1 and 2 with high field correlations at even the 5th week (~35 days lead time). While the skill of the model is more generally assessed at the weekly mean scale, it is nevertheless important to look at the individual day forecasts during the week of the heatwave event. Except for the week 1 forecast for Zone 1, which shows a very hot bias throughout the week i.e. an over persistence of heatwave conditions, a more general trend of an over-forecasting of initial days of the event (very hot bias) which gradually cools off as the week progresses is noted. A switchover to a relatively cold bias may imply an inability of the model to accurately forecast the persistence characteristics of heatwaves (stagnant high pressure zone, model dissipates heat quickly). However the reduction in the land-sea breeze either due to an anomalous Matsuno-gill response leading to a strengthening of the westerlies, or the effect of a late onset of monsoon, dropping of soil moisture to anomalously low levels, large increases in net surface radiation, and the total heat flux needs to be assessed in the model output.
Code and data: 1